

Oklahoma Gambling Facts
2022 Oklahoma Prevalence Study Results
1 in 16 (6.3%) Oklahomans meet the criteria for gambling disorder. 23.5% of Oklahomans are experiencing harm.
Taken together, nearly 1 in 3 (29.8%) Oklahomans are in need of some form of harm prevention, intervention, or treatment.


How does Oklahoma rank nationally?

2nd in the nation
for number of casinos*

3rd in the nation
for number of slot machines*

24th in the nation
in per capita funding for problem gambling services**
References
*American Gaming Association & GamblingCompliance. (2025). State of the states 2025: The AGA analysis of the commercial casino industry. Washington, DC.
**Marotta, J. & Yamagata, G. (2024). 2023 Budget Update: Publicly funded problem gambling services in the United States. National Association of Administrators for Disordered Gambling Services.
2022 Prevalence Study Summary
From April through August of 2022, Elite Research conducted a survey on behalf of OAPGG to measure the prevalence of problem gambling in the state of Oklahoma. The survey was conducted both online and through telephone interviews, with 4,050 adults over 18 surveyed. The collected data has been analyzed by Dr. Devin Mills and his research team at Texas Tech University. Read the full report.
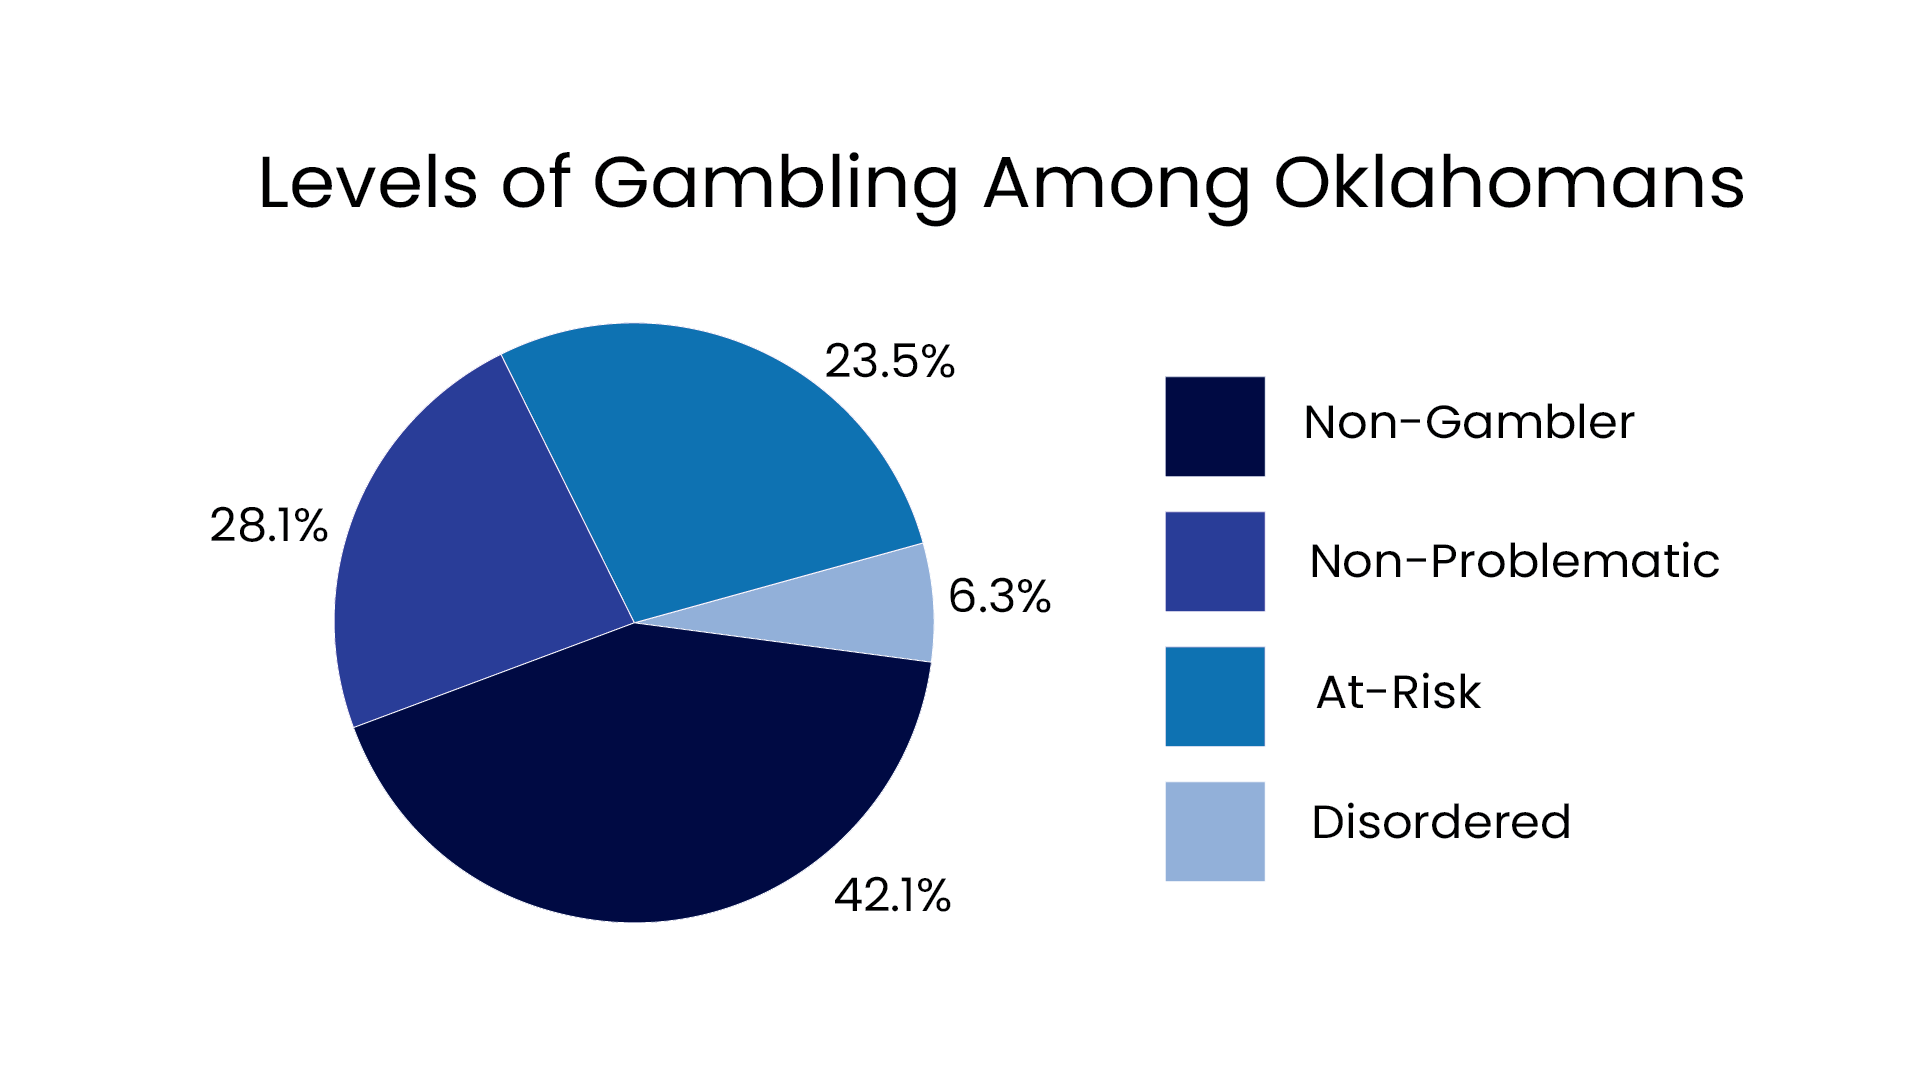
What percentage of Oklahomans are gambling?
57.9% of Oklahomans have gambled in the past year. This percentage includes the players who are not experiencing any harms, at-risk (experiencing 1 to 3 signs of a problem), or struggling with gambling disorder (experiencing 4 or more signs).

What is the most common symptom of problem gambling among Oklahomans?
Of the 9 criteria listed in the DSM-5, Oklahomans were mostly like to endorse criterion 8, experiencing interpersonal problems with a spouse/partner, important friend, or family due to gambling.

Do men and women have equal rates of problem gambling?
Males have a higher rate of at-risk classification, with 29.1% of males being at risk relative to 19.3% of females. About 6.6% of males and 5.8% of females meet the criteria for gambling disorder.

What age group is most at risk for a gambling problem?
The prevalence of problem gambling is highest for the 25-44 age group, at 8.7%. The under 25 age group and the 45-64 age group had similar rates, at 5.8% and 5.6%, respectively. The 65+ age group has the lowest rate of problem gambling at 2.8%.

How does racial background impact problem gambling rates?
Black or African Americans have the higher percentage of problem gambling (8.3%). Those who are of Hispanic, Latino, or Spanish origin have a significantly lower percentage of problematic players (2.6%) compared to those who are not of Hispanic, Latino, or Spanish origin (6.5%).

Does education or employment affect problem gambling and at-risk rates?
The proportion of at-risk players with less than a college degree (25.9%) is significantly higher than those with a college degree or more (21.9%), and the proportion of problematic players with less than a college degree (7.2%) is also higher than those with a college degree or more (4.9%).
At-risk and problematic play rates are higher for those who are employed (26.6% and 21.2%, respectively) compared to those who are not employed.
2025 Revenue and Contributions
Tribal gaming revenue (Class III only)‡: $3.64 billion
State revenue from tribal compact‡: $221 million
State’s allocation for problem gambling‡: $250,000
Lottery’s contribution for problem gambling‡: $750,000
‡Oklahoma Office of Management and Enterprise Services. (2025). Oklahoma Gaming Compliance Unit Annual Report: Fiscal Year 2025.
Social Media Campaign


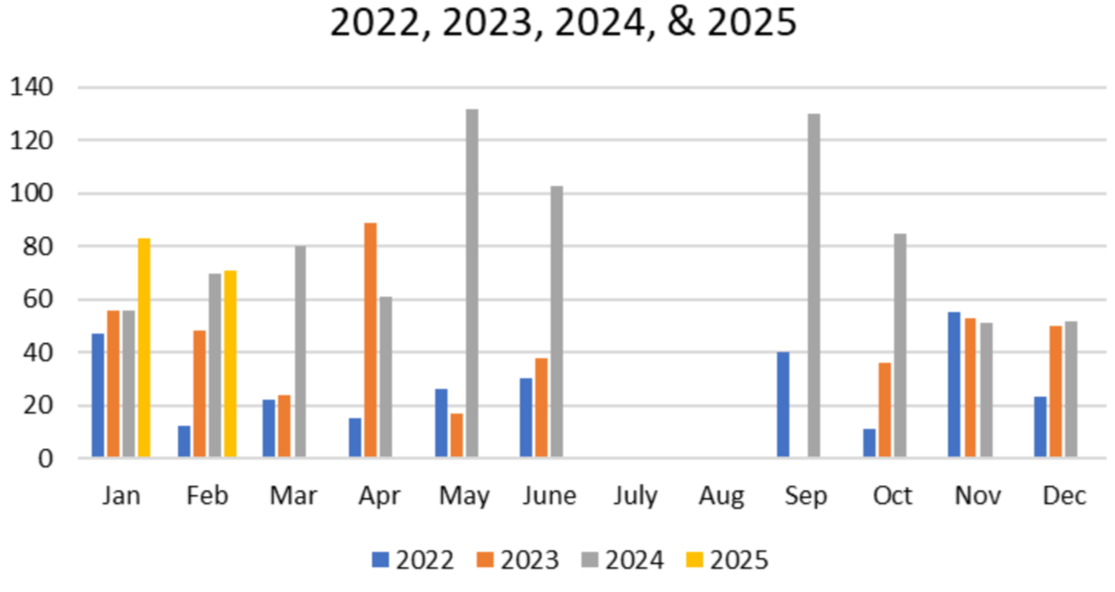
Requests for Information
Our social media campaign includes an Instant Form, through which people can request information on problem gambling services.
Each year, OAPGG sees an increase in the number of requests for resources.

OAPGG began a public awareness campaign on social media in 2022. Some of our social media creative are included below.


Statewide Self-Exclusion Data
We track the number of new statewide self-exclusions each year, as well as demographic data.